What Do We Know About the Tradeoffs Associated with Teacher Misclassification in High Stakes Personnel Decisions?

Dan Goldhaber and Susanna Loeb
Highlights

Dan Goldhaber
Director
Center for Education
Data & Research
Professor
University of
Washington-Bothell

Susanna Loeb
Professor of
Education
Stanford University
Faculty Director
Center for Education
Policy Analysis
Co-Director
PACE
- Evaluating teachers to group them in performance categories will inevitably lead to mistakes, regardless of: when in a career a teacher is evaluated, whether the rating is for high or low stakes, and how the evaluation is conducted.
- Mistakes occur because true teacher performance is not fully observable. As a result, we have to rely on imperfect measures.
- While classification errors are an inescapable part of decisions that rely on grouping by teacher performance, better measurement of performance can reduce these errors.
- Classification errors can be separated into “false positives” – putting a teacher into a group to which he does not belong – or “false negatives” – not classifying him into a group into which he does belong.
- Classification errors associated with performance measures based on student test scores are quite high. But the error rate of these “value-added measures” may be lower than the error rate of classifications based on traditional measures of teacher effectiveness such as licensure status or years of experience.
- Current evaluation systems rarely classify teachers as ineffective or needing improvement. Thus, the “false negative” rate for these classifications is probably high.
- We have little research to draw upon for designing systems or for predicting the effects of emerging evaluation systems. This calls for caution and for a better understanding of new systems in action.
Introduction
Better teacher evaluation should lead to better instruction and improved outcomes for students. But more accurate classification of teachers requires better information than we now have. Because existing measures of performance are incomplete and imperfect, measured performance does not always reflect true performance. Teachers who are truly high-performing will be classified as lower-performing and vice versa.[1]
Teacher classification is of course a necessity: policymakers and practitioners must decide who is eligible to teach in which classrooms and how teachers are promoted or compensated. School leaders have commonly used such measures as academic degrees, teaching experience, classroom observation ratings, and assessments by principals to make these decisions. Less common is the use of “value-added” estimates.[2]
But value-added measures are being used more and more as data systems are better able to make that student–teacher link. As they are, the measures are raising concerns about the implications for misclassification.[3]
Classification errors are troubling in and of themselves, but they are particularly worrisome when classification is used to sanction teachers.[4] The improper sanctioning of good teachers not only hurts those teachers, it may also keep capable people from entering the teaching profession.[5] On the flip side, poor teachers who are misclassified as higher performers will continue to teach ineffectively, often doing their students harm.[6]
Given the risk of misclassification, it is tempting to limit the number of personnel decisions that rely on these imperfect measures. Yet personnel decisions are unavoidable, and they hold significant potential for improving schools. Whether the decisions are active (e.g. choosing which teacher teaches 4th grade and which teaches 3rd grade) or passive (e.g. automatically renewing contracts from one year to the next), they must be made; school leaders can choose how to make personnel decisions but not whether to make them.
While all measures of teacher effectiveness are imperfect, the focus on misclassification has intensified recently with the use of value-added measures that rely on statistical means of translating student test scores into a measure of teacher performance. As with any measure, value-added can lead to two kinds of misclassification: putting a teacher in a group to which he does not truly belong – a false positive – or failing to put him in a category in which he does belong – a false negative.
The terms false positive and false negative can be confusing, because what is “true” or “false” depends on the hypothesis being tested, and the term “positive” does not necessarily connote that a teacher is effective or ineffective. For instance, if the measure is intended to identify ineffective teachers, then a false positive would occur when a measure of performance classifies teachers as ineffective when they are not, and a false negative occurs when a measure classifies teachers as effective when they are not. We should pay careful attention to both types of error.
Table 1: Outcomes Associated with Identifying Teachers who are Ineffective
| Teacher is truly ineffective | Teacher is not truly ineffective | |
| Performance measure suggests teacher is ineffective | Correct outcome, True positive |
Incorrect outcome, False positive |
| Performance measure suggests teacher is not ineffective | Incorrect outcome, False negative |
Correct outcome, True negative |
What is Known About Errors in Classifying Teacher Effectiveness?
In Figures 1a and 1b we illustrate the tradeoff inherent in classifying teachers. These figures show the hypothetical relationship between a measure of teacher effectiveness and true teacher effectiveness. Note that we are neither defining effectiveness (which means different things to different people) nor how it is measured. We purposefully do not define these concepts because we can never know the total impact that teachers are having on students.
Figure 1a: Identifying Low-Performing Teachers.
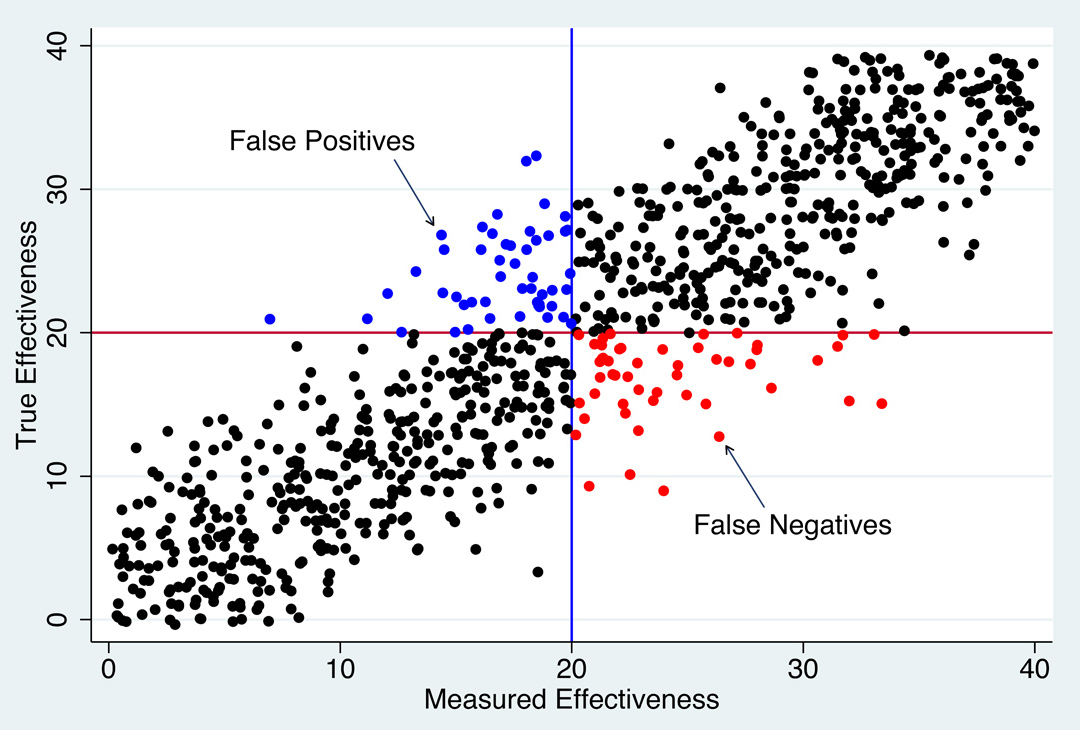
Source: Goldhaber and Hansen (2008)
Now imagine the goal is to identify very ineffective teachers, those whose true performance falls below some agreed-upon standard, say, a score that falls below 20 (red line). This mark could be the trigger for supplemental professional development, removal, or a variety of other responses. Again, we cannot directly observe true quality and thus cannotidentify all the teachers below the red line. Instead, we must use a proxy measure. In Figure 1a those who fall below the measured effectiveness minimum, also set at 20 (blue line), are deemed ineffective.
Setting the effectiveness minimum based on an imperfect measure will result in both false positives and false negatives: some teachers will be falsely classified as ineffective when their true effectiveness is above the cutoff, and others will be falsely classified as effective when their true effectiveness is below the cutoff. We can see these errors in Figure 1a. Those teachers above the red line (true effectiveness) on the vertical axis but below the blue line (measured effectiveness) on the horizontal axis are misclassified as ineffective – a false positive (represented by the red dots). Those teachers below the red line (true effectiveness) but above the blue line (measured effectiveness) are misclassified as effective – a false negative (represented by the blue dots).
It is, of course, possible to reduce the potential harm to teachers of misclassification. But reducing the risk of false positives leads to more false negatives, and vice versa.[7] Imagine shifting the blue line in Figure 1a to the left, as shown in Figure 1b. If we shifted it to 15, for example, hardly any teachers with true effectiveness above 20 would be misclassified as ineffective (there are fewer false negatives/blue dots). But there are now many more teachers, in the grey shaded area, who have true scores below 20 but who are misclassified as effective (there are more red dots). The tradeoff is inescapable.
Figure 1b: Identifying Low-Performing Teachers.
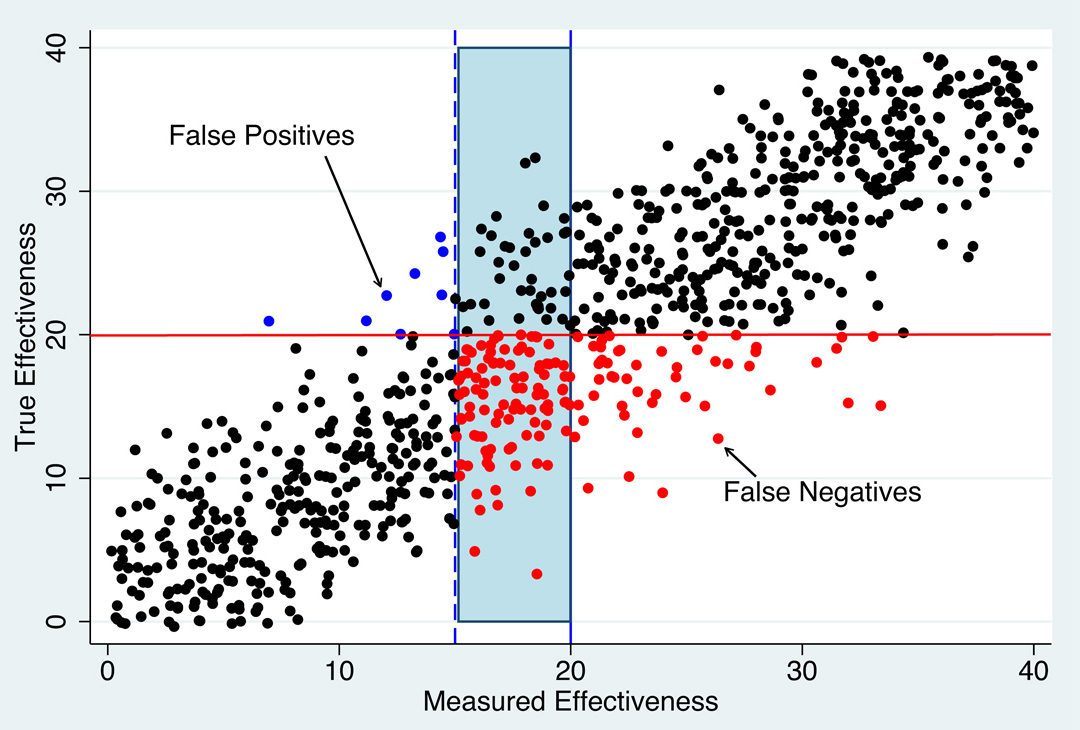
Source: Goldhaber and Hansen (2008)
Figures 1a and 1b focus on misclassification at the bottom of the teacher performance distribution, but the false positive/false negative tradeoff arises with any classification system. For example, a similar analysis could try to identify high-performing teachers. This exercise will also lead to misclassification. Some teachers who are not high-performing will be classified as such (false positives), while some teachers who are high-performing will not be classified as such (false negatives). In this case, the repercussions for teachers and students work in somewhat opposite directions than in the previous example. False negatives rob otherwise great teachers of the recognition they deserve.[8]
The better the measure of effectiveness – the closer it is to the truth about teacher performance – the less it will misidentify teachers. This relationship between the quality of the measure and the magnitude of misclassification is an important one. Poor measures of effectiveness – whether they are based on qualifications, observations, surveys, or student test performance – will lead to substantial misclassification. But, again, we emphasize that all measures of effectiveness will lead to some misclassification.
Misclassification is probably even greater than that described by Figures 1a and 1b because what we often want to know is how truly effective a teacher will be in the future, not how effective a teacher was at the time of measurement. That is, teachers are more effective some years than others, and using one year’s measure to predict future years will lead to further error. Still, the bottom line is the same: all measures of effectiveness are imperfect to some degree.
Having described the concepts of false positives and false negatives, we now review what is known about classification errors and their tradeoffs.
There are several approaches to estimating the extent to which misclassification occurs. Schochet and Chaing (2010), for instance, use simulations to assess the potential that value-added estimates would lead to false positives and false negatives, and how the magnitude of error varies based on the quantity of prior information available.[9] They conclude that using the sort of data generally available to districts will result in roughly 25 percent of those teachers deemed to be ineffective (at the 20th percentile of the teacher performance distribution or below) being misclassified into this category. And 25 percent of those classified as not being at the bottom of the performance distribution would be misclassified. Similarly, Bryk and Perez (2012) show through simulations the extent to which multiple measures of teachers will result in consistent classification by category.[10] They find that given the correlations we typically see among different measures of teacher performance, there is likely to be a significant number of false positives and negatives: teachers falling into one performance category according to one measure and into a different category according to another measure.
Another way to gauge the potential for misclassification is to focus on time-related differences in teacher performance. For instance, we may want to know how well we can classify teachers using their first year or two of measured performance relative to their measures of performance in future years. This type of misclassification helps tell us how well we can predict future measured performance, and, to the extent that true teacher performance is stable across time, it also provides information about how imprecise measures may lead to classification errors. If one assumes that true teacher performance is stable, then changes in teachers’ measured performance are the result of measurement error. The same concept applies to using differences in teachers’ measured performance across different sections (e.g. at the secondary level, where teachers often teach multiple sections of the same subject) to gauge the extent to which measurement error may lead to inaccurate assessments.
Table 2: Quintile Transitions from Initial Performance to Future Performance by Subject.
| Pre-tenure quintile rank | Post-tenure quintile (percent) | Total teachers | ||||
| Bottom | Second | Third | Fourth | Top | ||
| Panel A. Using first two years of performance to predict post-tenure performance | ||||||
| Bottom | 32 | 23 | 19 | 16 | 11 | 57 |
| Second | 27 | 14 | 27 | 18 | 14 | 56 |
| Third | 21 | 23 | 30 | 18 | 7 | 56 |
| Fourth | 16 | 27 | 18 | 18 | 21 | 56 |
| Top | 5 | 13 | 5 | 30 | 46 | 56 |
| Total Teachers | 57 | 56 | 56 | 56 | 56 | 281 |
Source: Goldhaber and Hansen (2008)
Table 2 from Goldhaber and Hansen (2008) describes the relationship between initial value-added measures and future value-added measures for math performance using North Carolina data.[11] Each cell of the table identifies the percentage of teachers in a performance quintile in one period (pre-tenure) that fall into the given quintile in a later period (post-tenure). Thus, for instance, the top row of the table shows the percentage of lowest quintile pre-tenure teachers who are in each quintile based on post-tenure performance (looking across the columns in the first row).
If we were interested in identifying low-performing teachers for the purpose of contract renewals, we might classify all teachers in the lowest 20 percent (first quintile) in their first two years as low-performing. The first row in Table 2 corresponding to “Bottom” identifies this group. The table shows that in future years these teachers are spread to some degree across all five performance quintiles. The error associated with using initial performance to predict future performance appears to be quite high: only 32 percent of teachers classified as low-performing in math are in the lowest performance quintile in future years, meaning that the false negative rate is 68 percent. [12] The false positive rate, those teachers who are not classified as low performing based on initial pre-tenure performance but who are low performing according to post-tenure performance is also 68 percent (i.e. those in column 1 but not in row 1). Atteberry, Loeb, and Wyckoff (2012) find similar false positives using data from New York City.[13]
Table 2 also illustrates the tradeoff between false positives and false negatives. If we wanted to reduce false negatives, thus limiting the potential harm to students of having ineffective teachers continue in the classroom, we might choose to set a higher bar, in the sense that we identify more teachers as ineffective initially. For instance we might classify all teachers who were initially in the bottom 40 percent of the performance distribution, rather than 20 percent as above, as low-performing (both the bottom and second quintile, identified by the first two rows in the table). Table 2 shows that with this classification, 69 percent of all teachers who were in the bottom quintile in later years (looking at the first two rows and the first column) would be classified as low-performing. Thus, this choice gives us a false negative rate of 31 percent, down from 68 percent.
But we can also see that decreasing false negatives leads to increases in false positives. Of the initial teachers classified as low-performing since they were in the lowest two quintiles in the first year (i.e. in the first two rows), about 70 percent are not in the lowest quintile based on post-tenure performance.[14] Thus the tradeoff associated with the reduction of false negatives is that false positive error increased from 56 percent to about 70 percent.
Both the Goldhaber and Hansen (2008) and the Atteberry, Loeb, and Wyckoff (2012) studies describe classification errors in the evaluations of new teachers. But personnel policies likely include classifications for all teachers. There may be fewer value-added classification errors for more experienced teachers because the first two years of teaching may be particularly volatile. There may also be ways of improving predictions for both new and more experienced teachers using multiple measures of teaching effectiveness.[15]
The error rates found in Goldhaber and Hansen (2008) and Atteberry, Loeb, and Wyckoff (2012), as well as those simulated by Schochet and Chaing (2010), appear to be quite high, which is one reason that using value-added for classification purposes is so controversial.[16] But it is important to put this in context. As shown in Table 2, few teachers who are misclassified as ineffective when they are not are classified are very effective later in their careers; many fall into the next lowest performance category, and few are in the top category.
Figure 2: Observed Relationship Between Teacher Licensure Test Performance and Effectiveness
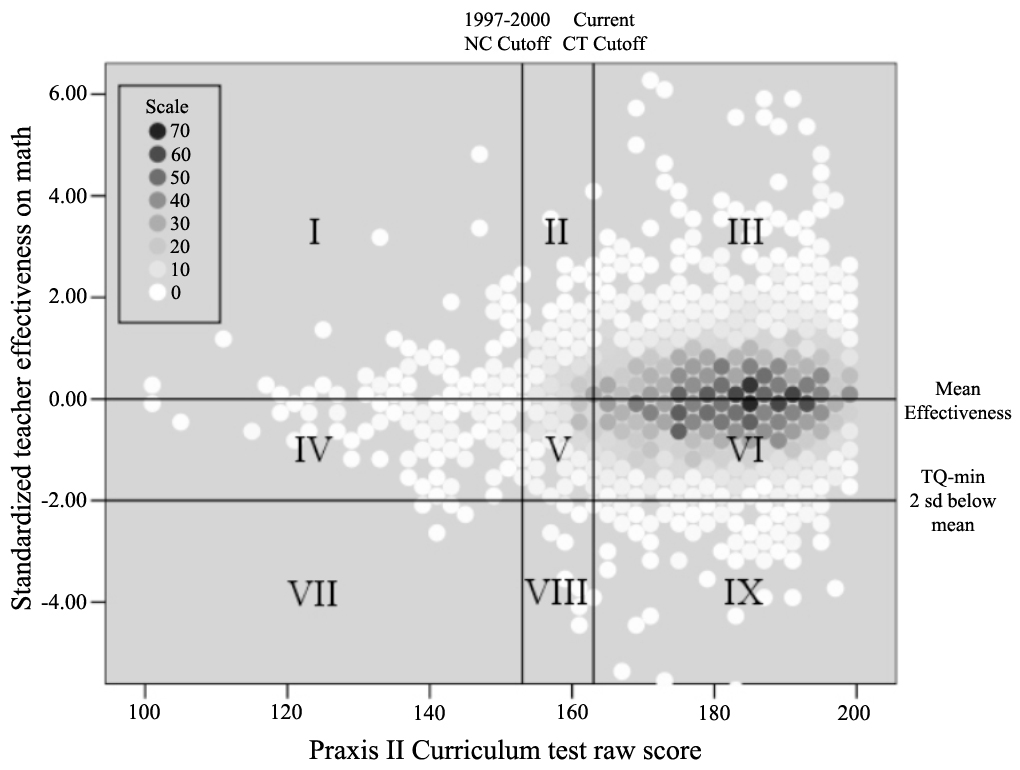
| Percentage of sample in each section: | ||
| I: 1.2% | II: 3.6% | III: 44.1% |
| IV: 2.1% | V: 3.6% | VI: 43.5% |
| VII: 0.1% | VIII 0.2% | IX: 1.6% |
| Note: Darker shades indicate greater density of observation. | ||
What often gets missed is that other measures do not look much better, at least in terms of predicting student performance in later years. Flawed as they are, value-added measures appear to be better predictors of student achievement than the teacher characteristics that we currently use for high-stakes employment and compensation decisions.[17] We illustrate this in Figure 2, which shows the relationship between teachers’ future classroom effectiveness (at the elementary level) as measured by value-added and their initial performance on licensure tests.[18] Of the 10.8 percent of the sample scoring below the current cutoff, 2.8 percent had value-added scores below the low cutoff (two standard deviations below the mean) compared with 1.8 percent of those not scoring below the cutoff. Thus, false positives – those who were better than the cutoff on value-added but worse on the initial exam – is 97.2 percent, and false negatives – those who were worse than the cutoff on value-added but better on the initial exam – is 84.2 percent.
It is worth emphasizing that while value-added appears to be a relatively good predictor of future student achievement on tests, it is not necessarily better at predicting dimensions of teaching that are not reflected in student test scores.[19] The bottom line, however, holds: misclassification can be cause for concern in all measures, regardless of what traits are being measured.
We have described errors associated with value-added using simulations and variation over time or across classrooms. A somewhat different approach considers how teacher classifications might change when there are limits to the types of information available (e.g. value-added, classroom observations, student perception surveys, and supervisors’ assessments.) In particular, we may be able to collect rich measures of performance for some teachers and more limited measures for others. In this case, we might want to look at the teachers with the richer measures and compare their classification based on those measures to what their classification would be under more limited measures. One advantage of this approach is that it does not presume that student test scores should be the primary metric by which classification errors are judged.
What More Needs to be Known on This Issue?
Misclassification is an inescapable part of decision-making. Yet by better measurement we can reduce misclassification, and by better balancing the two types of errors and considering carefully the consequences of these errors, we can reduce the harm of misclassification. To achieve these goals, we need to know more about measurement, about tradeoffs between false positives and false negatives, and about how best to structure the consequences associated with classification.
The licensure example highlights the importance of balancing the two types of measures. In the extreme, if no teachers are classified as ineffective, there are no false positives – no effective teachers are classified as ineffective. However, there are likely to be substantial false negatives – ineffective teachers being considered effective. It stands to reason that increasing false positives to reduce false negatives could benefit students. But we could use more research on the benefits and costs of such a change. How, for example, would better identification of low-performing teachers affect collaborative work, or the appeal of teaching to highly skilled workers? We also need a better understanding of how to reduce the consequences for students of false negatives. In many schools, students have only one or a very few teachers each year. By changing school structures to expose students to more and better teachers, we may be able to dilute the effects of the poor ones. For example, schools could adopt designs in which teachers specialize in instruction in subjects or grades in which they excel.[20]
Finally, a better understanding of the implementation of evaluation systems is called for. One of the reasons that evaluation reform is so controversial is that it is quite difficult to gauge its impact, despite some evidence that better evaluation can lead to better teaching.[21] Simulations can suggest what would happen if, for instance, ineffective teachers were removed from the workforce, but they cannot tell us what would happen if policies encouraging such removal were actually enacted. While there is a formulaic component to teacher ratings under some new evaluation systems, the identification and classification of teachers is fundamentally a human endeavor.[22] In many of the federal Race to the Top reforms, for instance, principals have a good deal of discretion over evaluations.[23] Will principals’ (or others’) assessments reflect the true variation in teacher performance? And will school systems take action against teachers judged ineffective?
There is relatively little evidence about how subjective judges will respond to new evaluation systems, but the existing empirical evidence around dismissals suggests that changes are likely to be modest. Jacob (2010), for instance, investigates a new contract for Chicago Public Schools that allowed principals to fire non-tenured teachers for any reason, without documentation and without the usual hearings.[24] He finds some evidence of an increased likelihood of schools firing teachers with frequent absences and/or lower value-added scores.[25] He also finds an increase in the overall rate of teacher dismissals from roughly 10 percent to just under 20 percent, though over half of those teachers were rehired into another district school in the next year.
Perhaps more significant than how principals will respond is how teachers will respond to additional information about their performance and to the consequences attached to it. Will those rated ineffective be more inclined to seek out high-quality professional development? Will pre-service preparation improve to meet the new demands? Will increased scrutiny affect attrition or interest in teaching as a career? These are important questions that cannot be answered by existing research.
If new evaluation systems succeed in identifying good teachers, we might also expect them to elevate the profession, encouraging more capable individuals to pursue teaching or existing teachers to stick with it.[26] On the other hand, if new evaluation systems are perceived to be unfair, then we might expect the opposite result.[27] The importance of a fair work environment might be particularly important for teachers, many of whom were attracted to the profession to provide nurturing and fair environments for students.[28] And there is another factor: teaching today is a relatively low-risk occupation in terms of compensation and job security; the introduction of greater risk in the form of consequential performance evaluations reduces that security. In the absence of compensatory improvements such as higher pay, the loss of security might discourage capable people from becoming teachers.
Finally, how will the system handle legal challenges to the use of student growth measures for high-stakes teacher evaluation? There are a number of relevant federal, state, and local laws that bear on this question.[29] Precedent suggests that courts generally will review the employment-related decisions of districts and schools (including as they relate to evaluation systems) with a significant degree of deference (EducationCounsel, 2012).[30] This deference likely extends to the judgment that educators should be evaluated in part on the basis of the academic gains of their students. Courts are also more likely to defer to districts when the state or district can demonstrate that the evaluation system in question was thoughtfully designed and consistent with sound educational principles. A state or district can strengthen its position further by showing that it sought out and considered viewpoints by multiple stakeholders when it designed the system.[31]
Additionally, courts and other arbiters are likely to recognize that there is more at stake than the employment interests of the aggrieved educator. There is, mainly, students’ right to a quality education, acknowledged by state constitutions. At least one federal court has opined that an evaluation system’s false positive, in which students continue to be instructed by an ineffective teacher who was classified as the opposite, “involves greater social costs” than a false negative. Research suggests that previous evaluation systems did a poor job of distinguishing among levels of effectiveness and that the indicators used were not always correlated to strong instructional practice. Courts will likely recognize that value-added measures are intended to improve those systems.
At the same time, the use of these measures moves policy into somewhat unchartered waters. Critical reviews of an evaluation system will consider the degree to which the system and its components are valid and reliable. States or districts must be able to link student growth to the appropriate educators and validly address how an educator’s impact on growth is reasonably and fairly assessed.[32] Ultimately, employment decisions need only be based on evaluation systems that are sufficiently valid, not perfect.
As we have noted, school districts are already attaching crucial employment decisions to inputs such as licensure, experience, and level of educational degree. What makes these elements different from measures based on student growth is that they may be gauging aspects of teacher quality that are not captured by student tests. Thus, ironically, they may be more defensible.[33]
While many of the new evaluation models call for consistent measures linked to high-stakes decisions, they are not typical of other professions, where more often multiple measures and subjective assessments affect a series of moderate-stakes decisions. We have little depth of research or professional experience upon which to design new systems of evaluation, or to predict the effects of those that are already emerging. Thus, there are many reasons for caution. More accurate measures of teacher effectiveness can lead to better decisions by school and district leaders. But the actions we take based on those measures can have both beneficial and harmful consequences. Clearly, we need a better understanding of the consequences of different systems on teacher development, teacher collaboration, and the desirability of teaching as a profession.
What Can’t be Resolved by Empirical Evidence on this Issue?
It is unlikely that empirical evidence will shed much light on the matter of when in a teacher’s career high-stakes decisions (e.g., licensure or tenure) should be made. Decisions made very early (e.g., before a teacher has even entered the classroom) could prevent career uncertainty and other negative consequences. More stringent up-front evaluation would bring teaching more in line with other professions, such as law or medicine, which establish higher barriers to entry.[34] The downside is that such decisions would be based on little direct information about actual performance unless pre-service teacher education programs substantially expand their use of evaluation. Thus, these programs may reject a high proportion of candidates who would have made good teachers.[35] Unfortunately, without fundamental change to the structure of the teaching market, we are unlikely to learn a lot about the efficacy of making critical decisions at different points in a teacher’s career.
At a more basic level, research cannot address whether teacher evaluation policies involving classification result in the “right” tradeoff between false positives and false negatives. The reason is that even if evidence showed the impact of such policies on observable outcomes, such as student test scores, we know that good teachers produce learning gains in areas that go beyond tested academic subjects. “Soft skills,” such as citizenship and perseverance, for instance, are important to a student’s future success, but they are difficult to quantify.
Practical Implications
How Does this Issue Impact District Decision Making?
Hiring one teacher over another, granting tenure or not, selecting instructional leaders – these are important decisions that affect both educators and students. They can be unpleasant and difficult, and the measures that administrators use to make them are incomplete and imperfect. Thus, some decisions that are based on measured performance will not reflect true performance, resulting in misclassifications. We rightfully have been concerned with the misclassification of good teachers as poorer ones. But what we have tried to emphasize above is that the opposite scenario is also worrisome. While good teachers may be dismissed, bad ones may stay in the classroom – an error that has considerable long-term effects on the students placed in those classrooms.[36]
The magnitude of both false positives and false negatives should be considered in personnel decisions. But it has not always been. In most districts, policy calls for teachers’ contracts to be automatically renewed. Renewal is essentially based on a teacher’s certification status, making certification the de facto mark of acceptable performance. Yet, as we have shown, misclassification resulting from this measure is likely to be considerable. While the false positive rate is very low, the false negative rate is likely to be quite high: very few truly low-performing teachers are flagged for targeted supports or dismissal.
In addition to considering the magnitude of both types of classification error, it is important to consider the consequences of error. If the consequences of false positives are much more severe than the consequences of false negatives, then allowing for more false negatives might make sense. In the case of low-performing teachers, the adverse consequences of non-identification can be high for students, especially if they have only that one teacher for the entire school year. If the consequences for a teacher of false identification are interventions such as more intensive professional development, then they may not be that high. But if the false identification results in the teacher’s dismissal, then the consequences are, of course, great. Better measures of teacher effectiveness, both value-added and other kinds, could reduce both types of error. But, given that misclassification is inescapable, reducing the consequences of the problem is an important additional goal and one with potentially large payoffs – particularly for students.

Recent Comments
No comments to display